|
Hint |
There is a video tutorial for using the eGAFOR Viewer.
The video is also available at https://www.youtube.com/watch?v=EpxdtO9yTMw. |
| Access |
|---|
| eGAFOR Viewer is available at https://egafor.eu . It can be viewed on mobile devices, as well as on desktop devices. |
| Purpose |
|---|
| eGAFOR Viewer is tool for viewing the latest the eGAFOR forecast, i.e. the forecast polygons and the impact of the forecast on the eGAFOR flight routes. The eGAFOR forecast is a uniform, harmonized, probabilistic, graphical, colour-coded Low Level Forecast (LLF) for VFR Flights up to FL 100. |
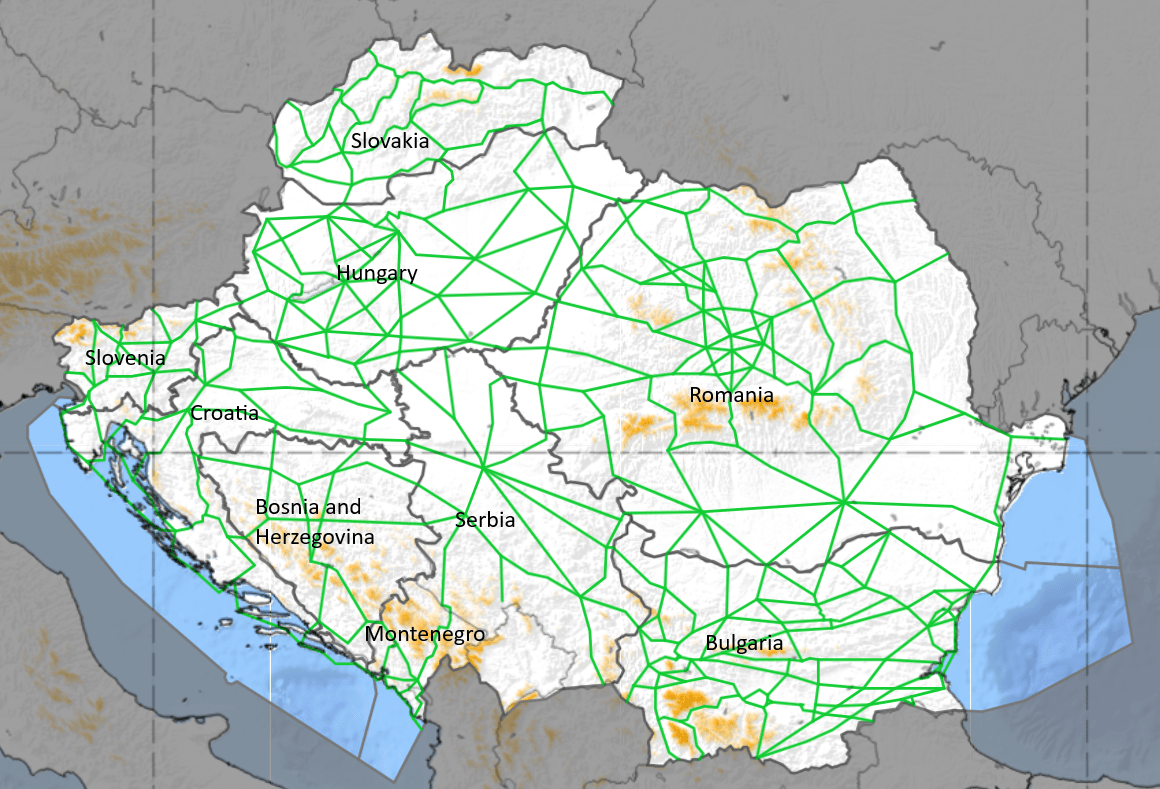
eGAFOR Routes
The area of the continuous route network covered by the eGAFOR forecast is given in the image below. The eGAFOR routes are harmonized and connected at cross border points. The eGAFOR route is a smooth stripe 1200 m wide that follows the terrain. Each route has its reference height, which is the altitude of the highest geographical obstacle on the route. Reference altitudes are rounded-up to 100 ft.
| Area and routes | FIR | MET Provider |
|---|---|---|
|
|
Beograd | SMATSA (Serbia and Montenegro) |
| Bratislava | SHMU (Slovakia) | |
| Bucuresti | ROMATSA (Romania) | |
| Budapest | OMSZ (Hungary) | |
| Ljubljana | ARSO (Slovenia) |
|
| Sarajevo | BHANSA (Bosnia and Herzegovina) | |
| Sofia | BULATSA (Bulgaria) | |
| Zagreb | CCL (Croatia) |
Login
When you go to the eGAFOR Viewer start page, the login section will be displayed.

- Click the Sign in button and then enter the user name and password that were issued for you when you registered. You can sign in by using your Google Account without needing to register.
- Alternatively, click Proceed as guest: you will be able to view the eGAFOR forecast, but you will not be able to change the settings. If you selected this option, you will be also able to sign in later, from the eGAFOR Viewer by clicking the Guest arrow in the right top corner and selecting the Sign in option.

 |
Note |
eGAFOR forecast not availableIf for some reason the eGAFOR forecast is not available (it was not issued, there is some technical problem, etc), a greyed out map will be displayed with the information: "There are no data available".
ConsentThe site uses cookies and the eGAFOR forecast is not a regulated product. Both this information will be displayed after the login. Click the Consent buttons to accept the usage of cookies and to acknowledge that you are aware that eGAFOR is not a regulated product.
|


Layout
The eGAFOR Viewer has the following layout:
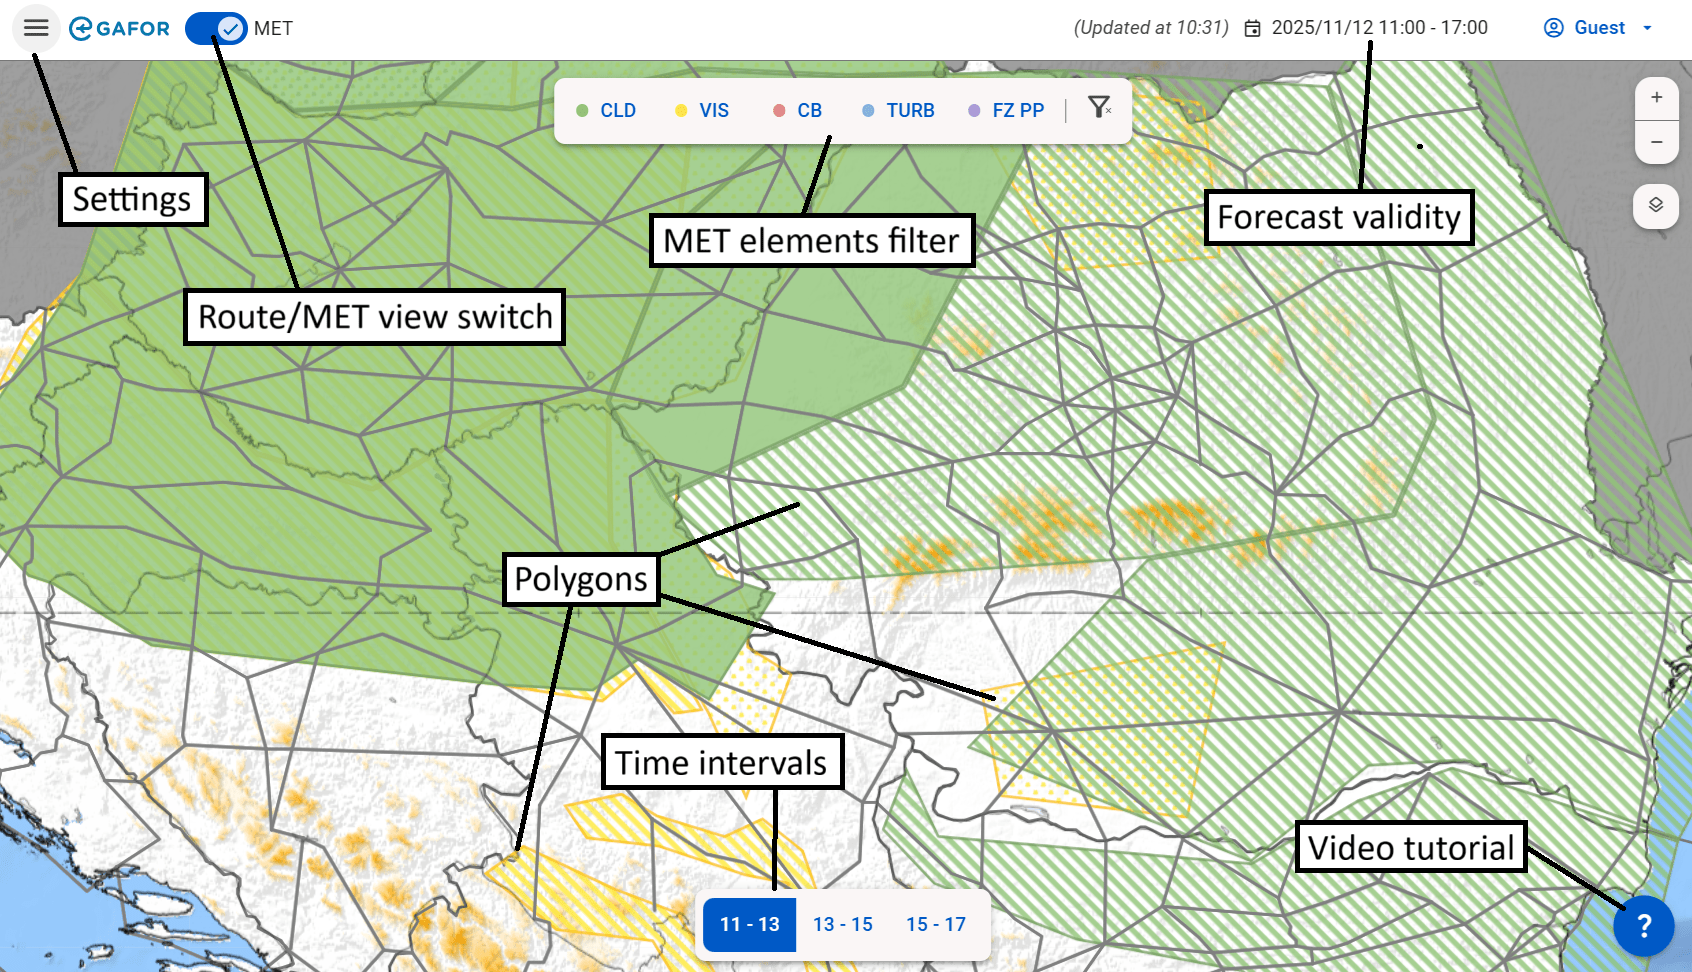
Validity time
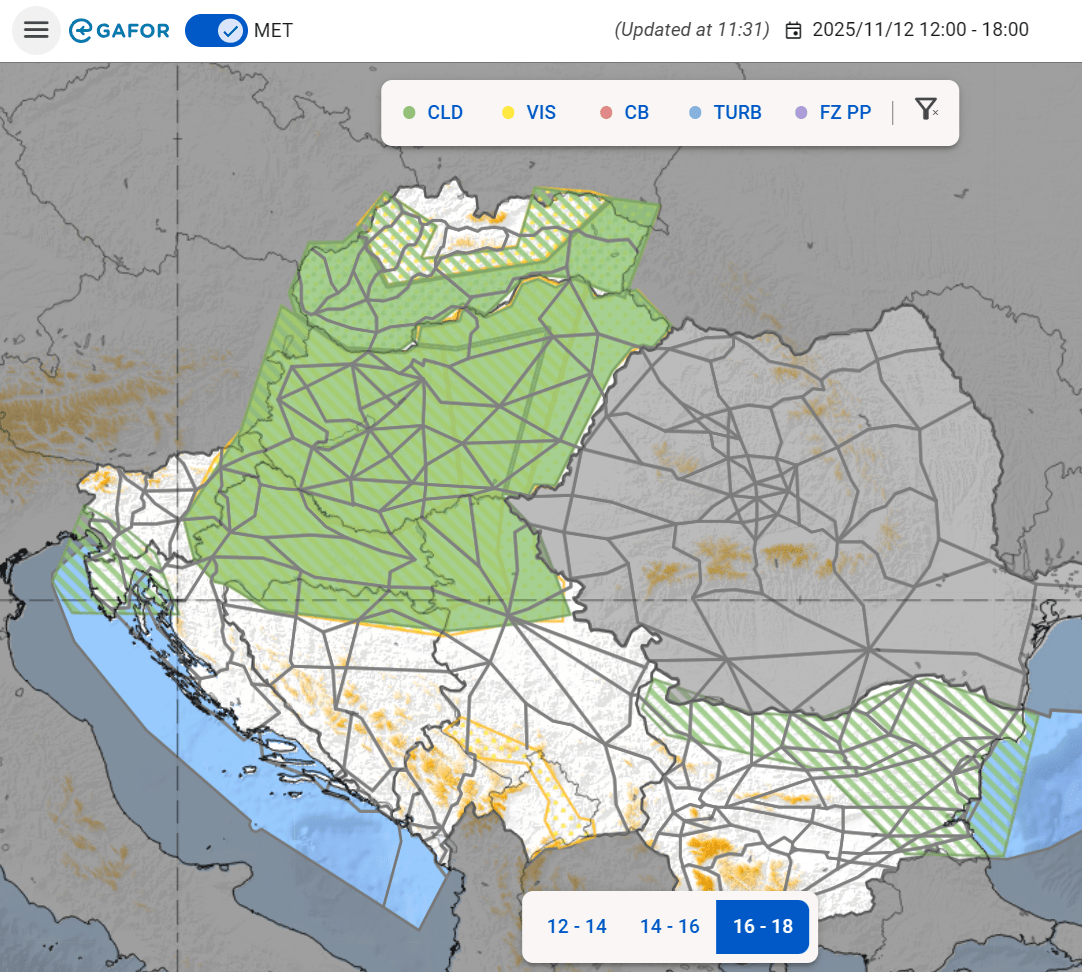
By default, eGAFOR Viewer displays the latest issued eGAFOR forecast.The forecast validity and the time when the forecast was created/updated is indicated in the top right corner.
The validity time of the eGAFOR forecast is 6 hours and it is divided into three 2-hourly intervals. Each polygon refers to a 2-hourly interval.
- Use the time buttons at the bottom to select the required forecast period.
Whenever the eGAFOR forecast is updated, a notification will be displayed and the latest version of the forecast will be displayed.

|
Hint |
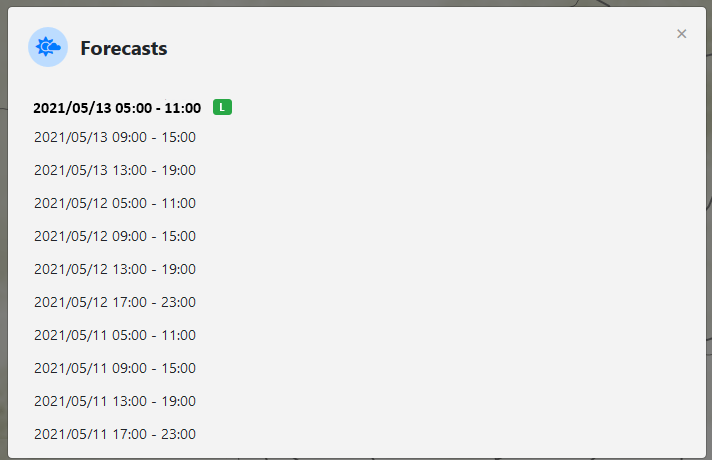
Viewing older forecastsIf for some reason you want to check some previously issued forecast instead of the latest forecast, click the forecast validity in the top right corner - the dialog with the list of available forecasts will be displayed:
Select the forecast that you want to display: the forecast validity will be highlighted in red to indicate that this is not the latest available forecast.
To return to the latest forecast, click the forecast validity again and select the latest available validity: this is the forecast at the top of the list, indicated with bold and marked with |


The time of issuance, validity period and 2-hourly intervals used in the eGAFOR forecast are summarised in the table below.
| Issue time (UTC) | Validity periods | ||
| 1st period | 2nd period | 3rd period | |
0200 |
03 - 05 |
05 - 07 |
07 - 09 |
0600 |
07 - 09 |
09 -11 |
11 - 13 |
1000 |
11 - 13 |
13 - 15 |
15 - 17 |
1400 |
15 - 17 |
17 - 19 |
19 - 21 |
Depending on the duration of the illuminated part of the day not all time intervals of the eGAFOR forecast may be issued. If a forecast has not been issued for a specific time or due to technical reasons, the whole area of the responsibility of a certain provider (e. g. FIR) will be greyed-out for the selected time interval (see section Unissued Forecasts below).
Display Options
It is possible to adjust the display in several ways. The display options basically depend on whether the MET slider is on or off.
View polygons or route impact
Use the MET slider on the top toolbar to select the type of view:
View 1: MET slider on: forecast polygons are displayed
View 2: MET slider on: off: route impact is displayed
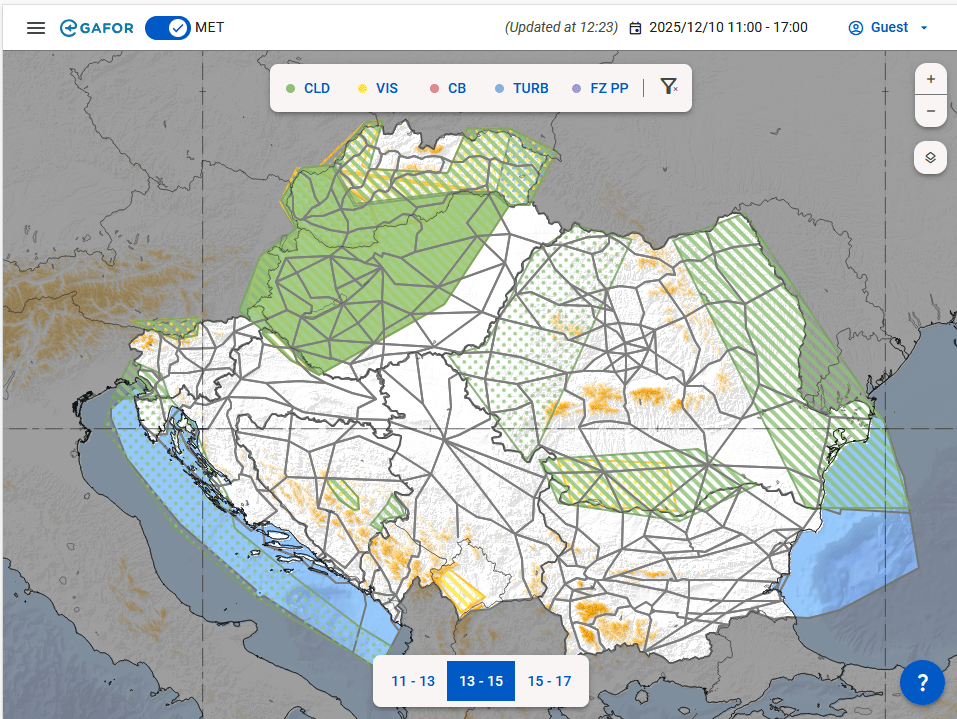
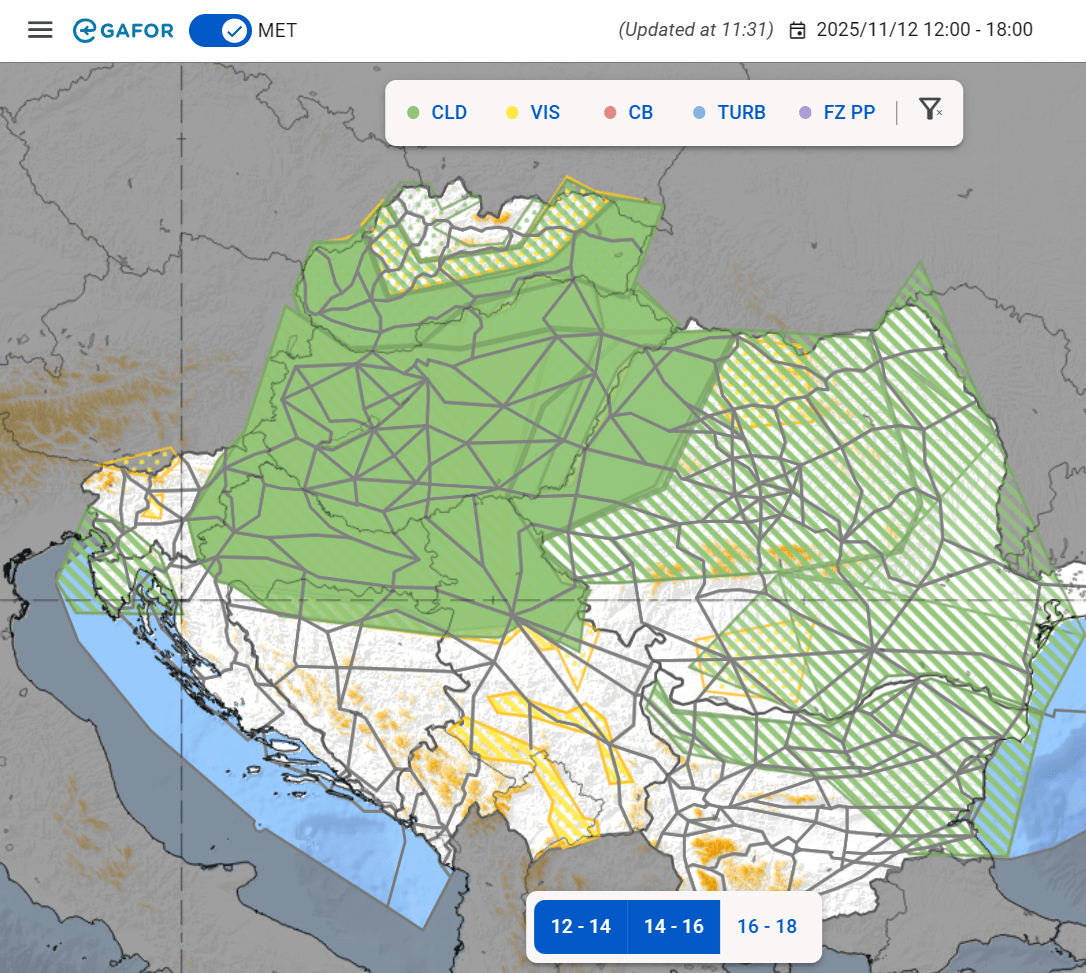
MET slider is on: polygon display

When the MET slider is on, the forecast polygons are displayed. In this case it is possible to display details about polygons or filter the polygon display. The colour of the polygon indicates the polygon type:
| MET phenomenon | Abbreviation | Description | Colour |
|---|---|---|---|
| BKN/OVC clouds | CLD | Cloudiness coverage more than 4/8 | green |
| Visibility | VIS | Horizontal visibility on the ground level below 8 km | yellow |
| Cumulonimbus | CB | Horizontal distribution of CB clouds | red |
| Turbulence | TURB | Turbulence in Low Level Flight altitudes | blue |
| Freezing precipitation | FZ PP | Any precipitation which freezes on contact with surfaces | purple |
Example of polygons with high impact (fully coloured):
|
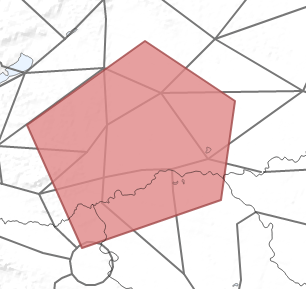
CB Cumulonimbus area is shown as red
|
TURB Turbulence area is shown as blue  |
|
|
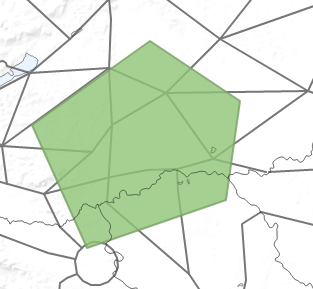
CLD Cloud area is shown as green |
VIS Visibility area is shown as yellow |
|
|
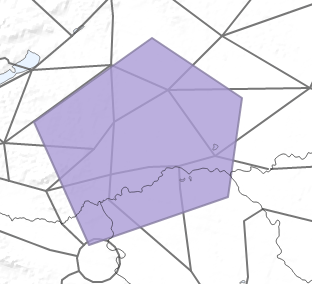
FZ PP Freezing precipitation is shown as purple |
|

The fill style of the polygon indicates the impact type (see section MET slider is off: impact display below for explanation of different impacts):
|
red impact (closed) - solid fill  |
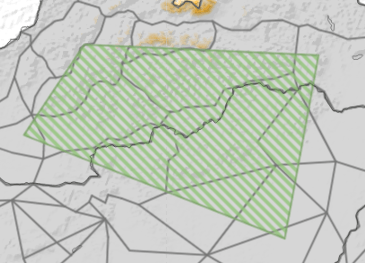
orange impact (marginal) - stripes
|
yellow impact (difficult) - dots
|

View details
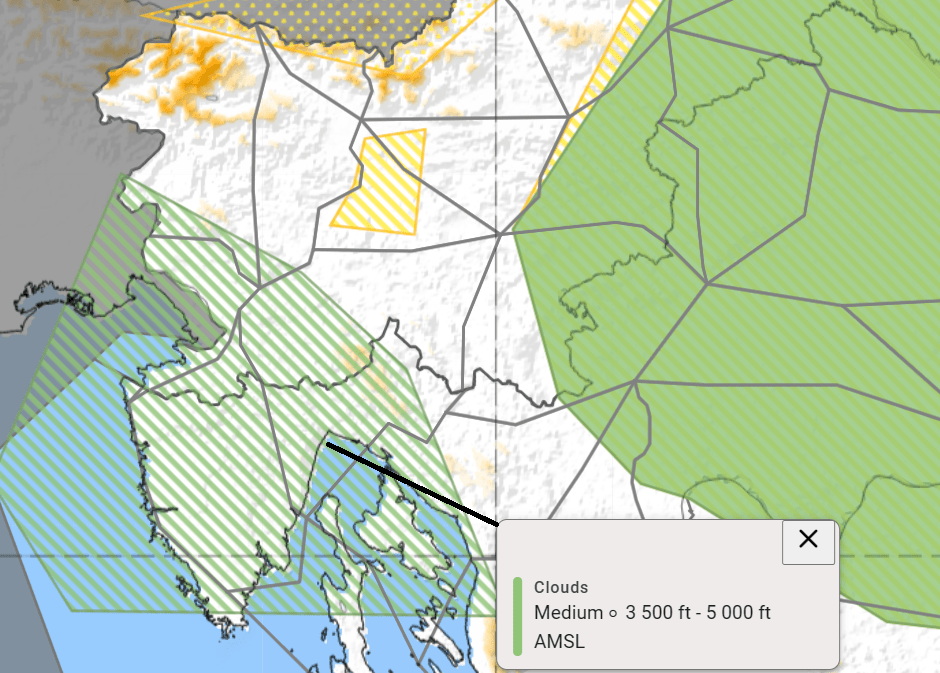
When the MET slider is on, it is possible to display the detailed information about polygons: click the polygon and the description of the polygon will be displayed in a pop-up box above the forecast periods. The following information is displayed:
- Polygon highlighted with black outline
- Type: type of the polygon, e.g. Clouds. The type of the polygon is also indicated by the colour of the stripe on the left.
- Probability followed by the other polygon properties
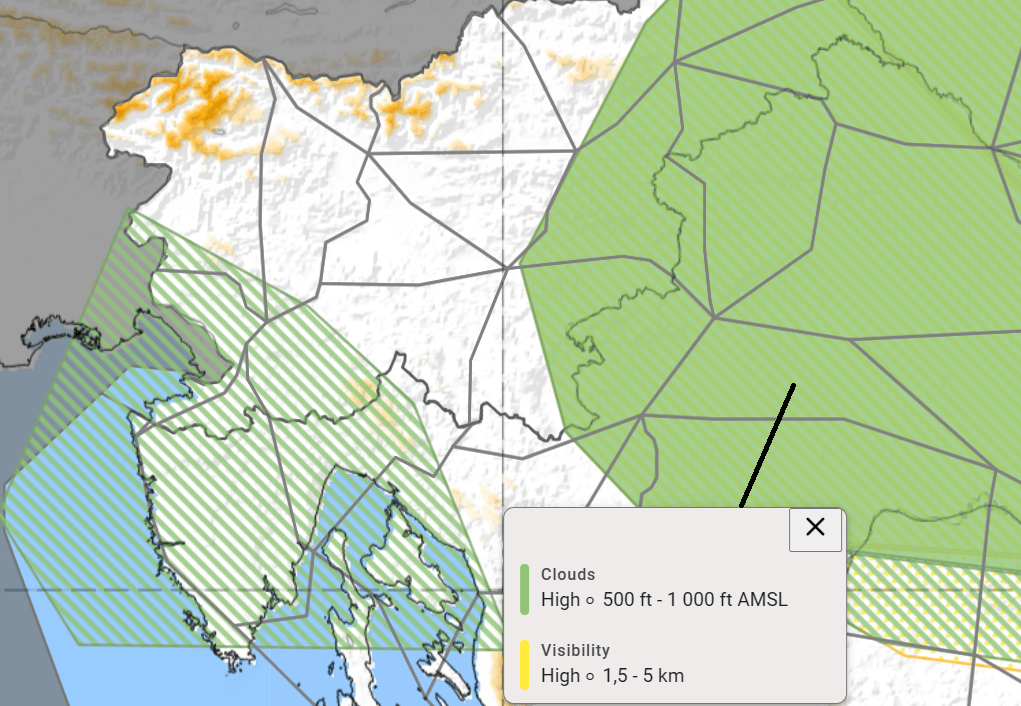
If there are overlapping polygons, the tooltip will display the details from all polygons that are situated at the same location:
If the tooltip is displayed and you change the forecast period, the tooltip will be updated:
- if no polygons are present at the clicked point, the tooltip will disappear.
- if some polygons are present in the newly selected interval, the tooltip will show the polygon information for the newly selected forecast period.
Limit the polygon display according to phenomenon
When the MET slider is on, it is possible to use the top bar with the phenomena for filtering which phenomena should be displayed:
- If no selection is made on the toolbar, all polygons are displayed.
- To display only a certain phenomenon or phenomena, click the buttons of the phenomena that you want to see. For example, in the screenshot below the CLD and CB buttons were clicked so only the low cloud and the cumulonimbus cloud polygons are displayed.
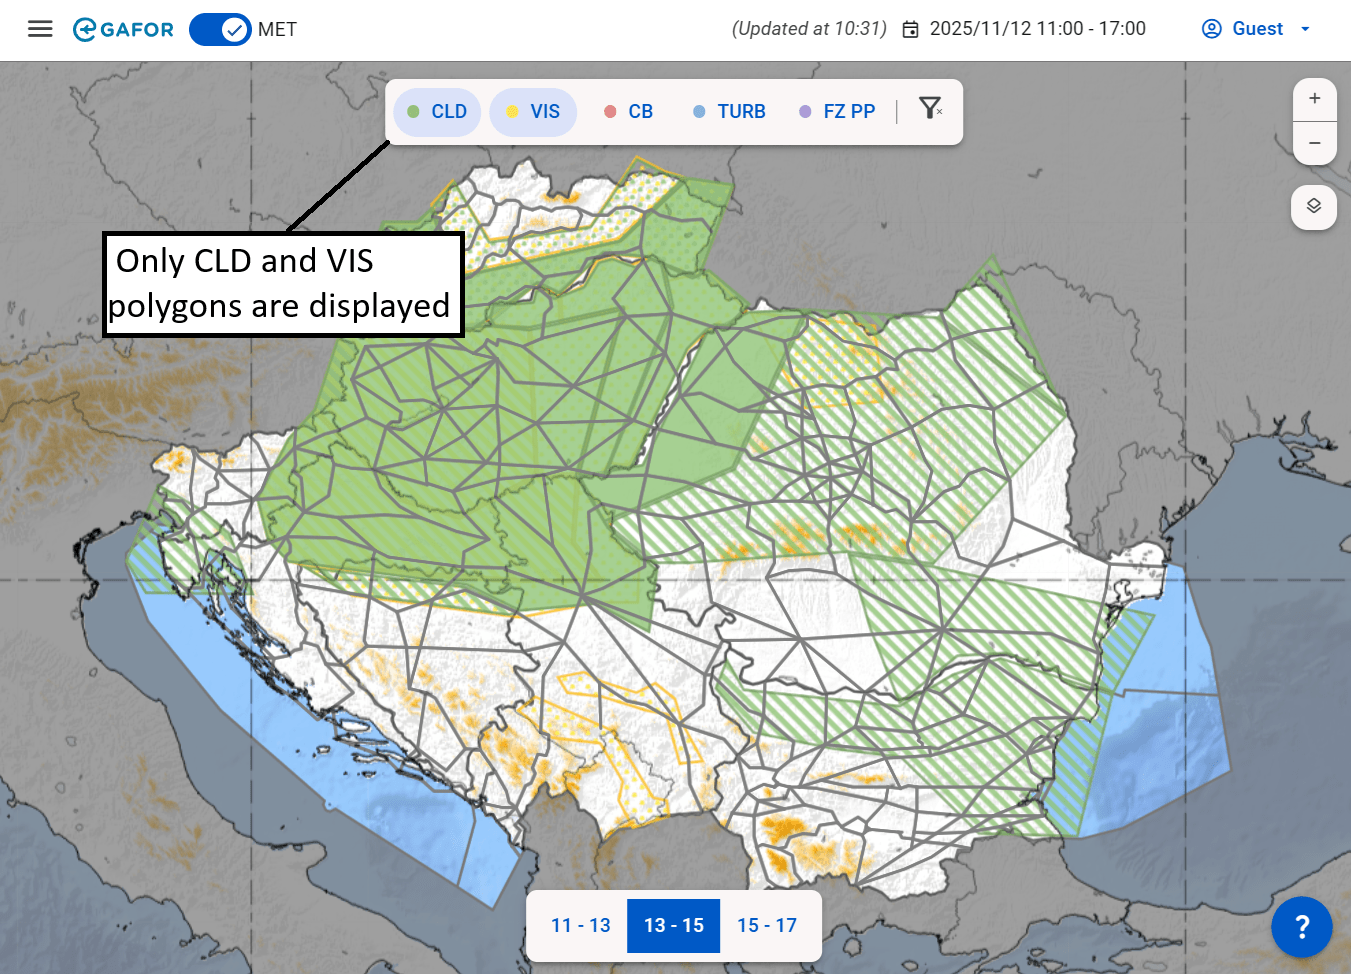
- To cancel the selection, click the phenomenon button again. To cancel all selection and to view all polygons, click
 .
.
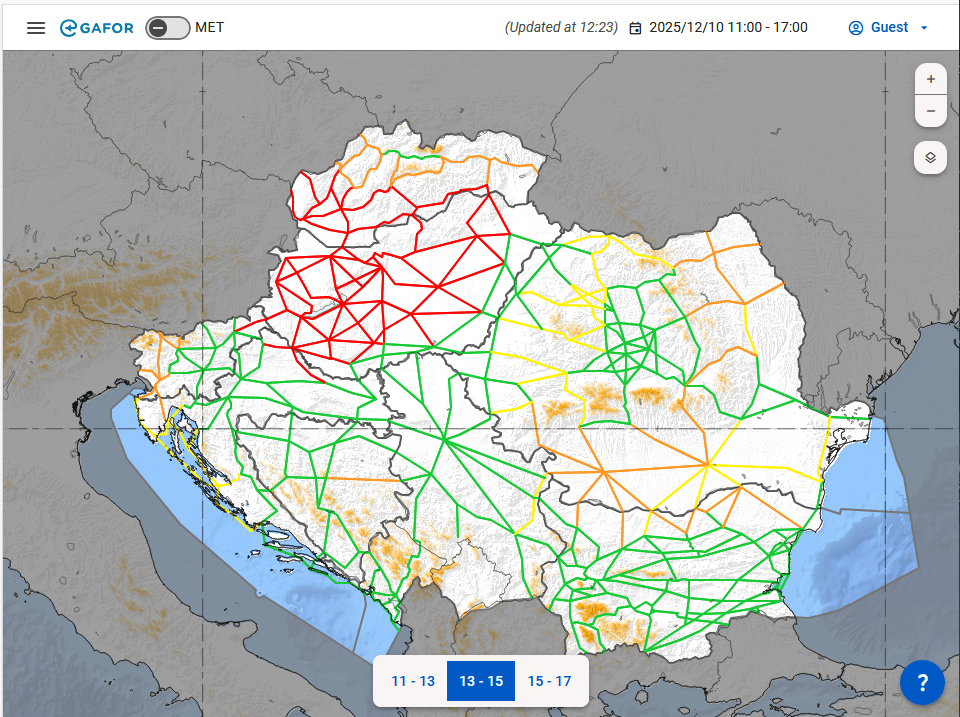
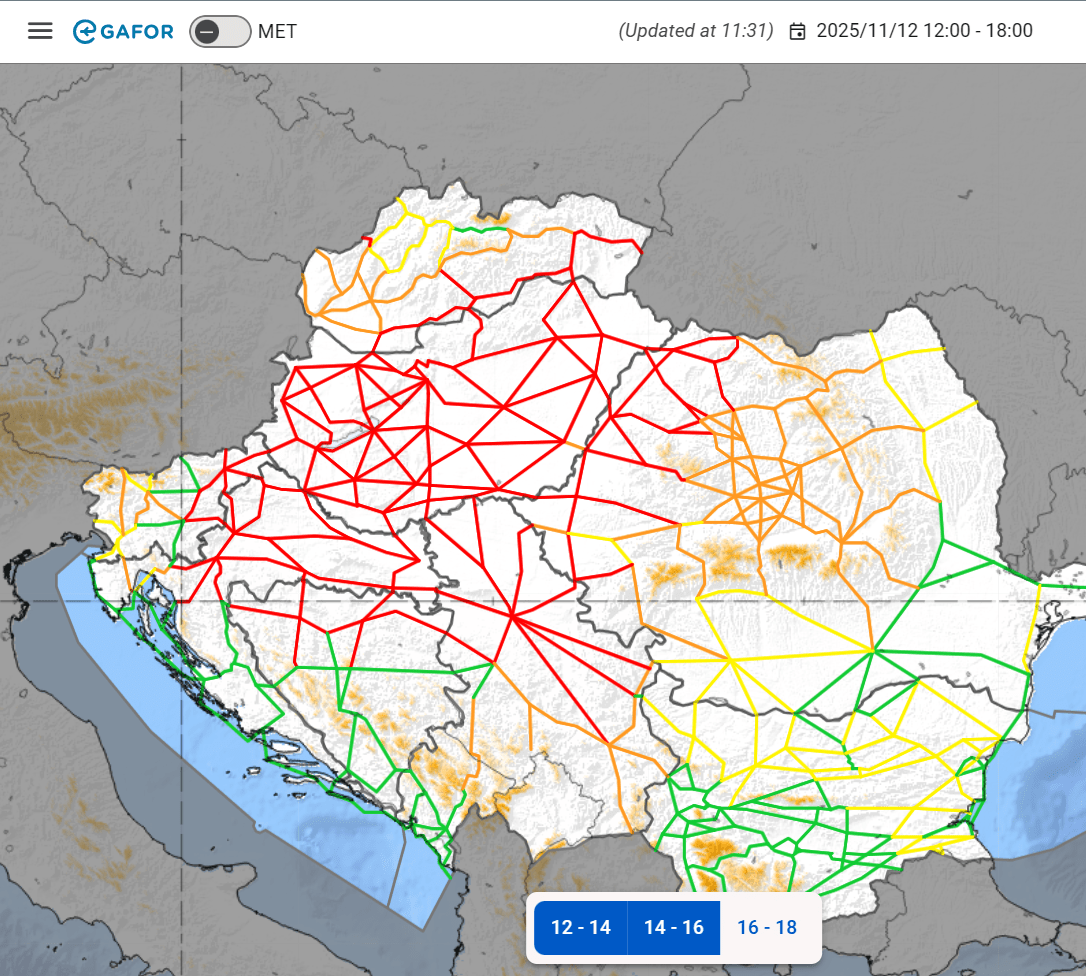
MET slider is off: impact display

When the MET slider is off, the route network is displayed, showing the eGAFOR forecast translated to impact on the individual routes.
- The impact is determined on the basis of the probability of occurrence and the severity of the phenomenon (see eGAFOR - Terms and Definitions for detailed description of the impacts).
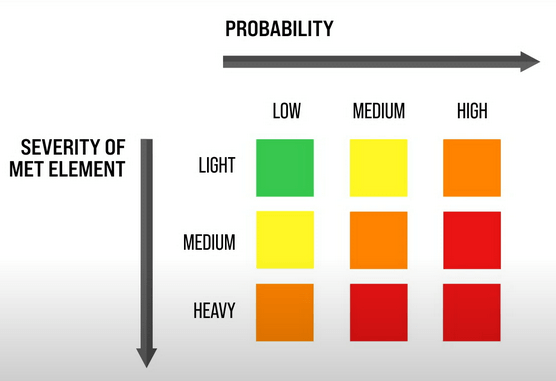
Impact is displayed by applying traffic light colours to the routes:
green Open Routes which are not impacted yellow
Difficult weather conditions For VFR operations high level of skills and knowledge of local conditions is required orange Marginal conditions Not suitable for standard VFR operations; high level risk for air crew under VFR conditions; high level of skills and knowledge of local conditions and terrain is required red Closed
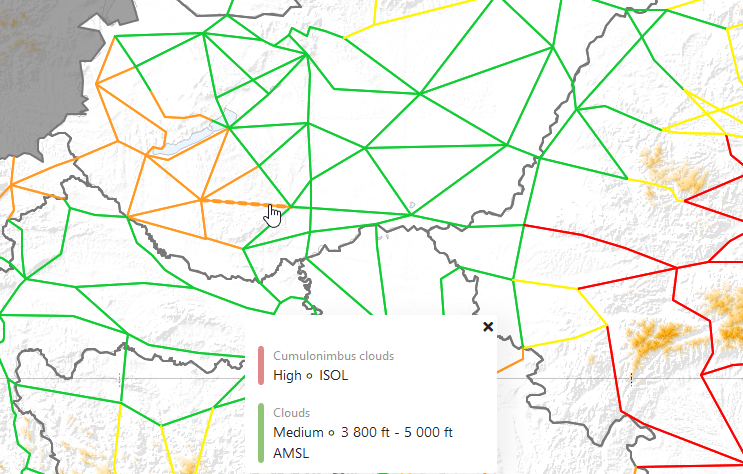
View details
When the MET slider is off, it is possible to display the detailed information for each route. Click the route and the description will be displayed in a pop-up box above the forecast periods. the route will be indicated as a thicker dashed line and the following information will be displayed:
- Type: type of the phenomenon, e.g. Clouds. The type is also indicated by the colour of the stripe on the left.
- Probability followed by the other properties forecast for the polygon that is affecting the route
- If the route is affected by several polygons, the details of all impacting polygons are listed in the tooltip.
If the route is selected and you select a different forecast period, the tooltip will show the information for the newly selected forecast period.
Limit the route display according to phenomenon or cloud base
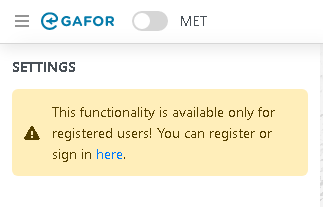
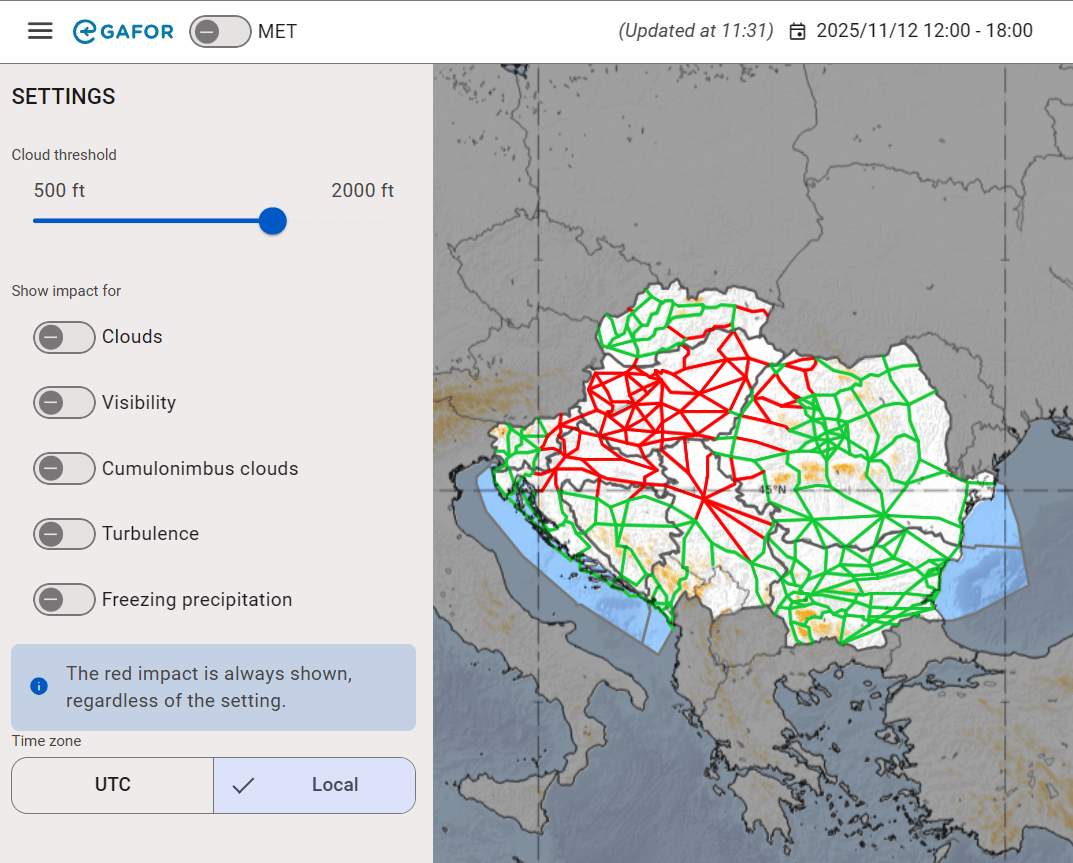
When the MET slider is off, it is possible to use the settings to specify which route impact should be displayed. Click ![]() in the top left corner to display the settings.
in the top left corner to display the settings.
|
Note |
| The Settings section is only available for registered users who are logged in. To use the settings, make sure you are logged in, or if you do not have a log in, click
|
Cloud threshold
Cloud base is forecast in feet above MSL. Since it is difficult to forecast the exact altitude of the cloud base, the forecast cloud includes an uncertainty zone: zone between the minimal and maximal value of forecast cloud base.
The default cloud threshold is 1500 ft. If you are a registered user, you can used the slider to adjust the cloud threshold, i.e. level for the flight: the routes will show the impact of the clouds, i.e. whether the flight is below or above the forecast clouds (and uncertainty zone). It is possible to specify a value between 500 ft and 2000 ft.
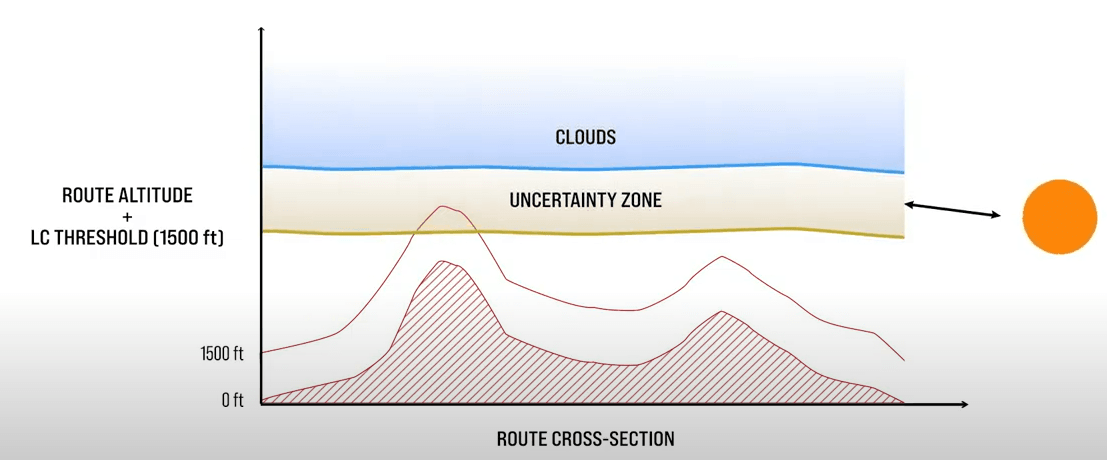
If the cloud-base and uncertainty zone is above the route altitude + specified LC threshold (default is 1500ft), there is no impact (green).
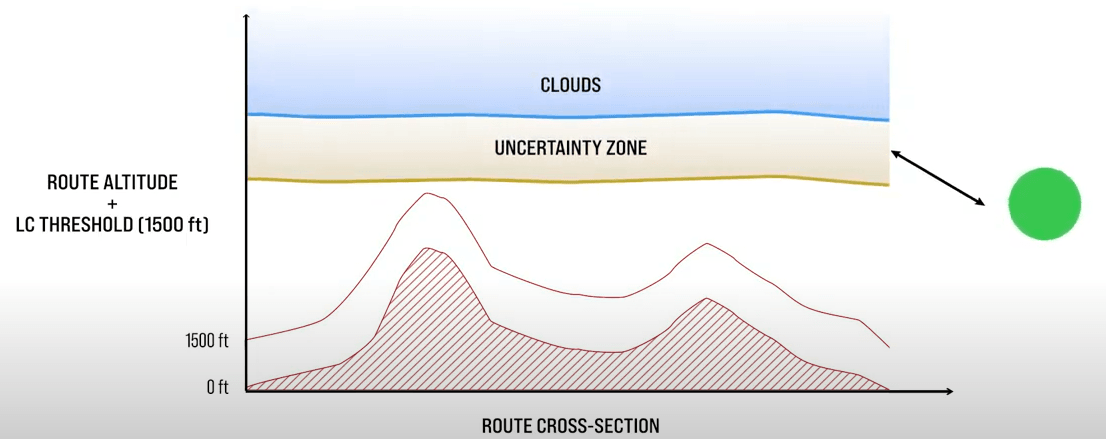
If the cloud-base and uncertainty zone is below the route altitude + specified LC threshold (default is 1500ft), the impact changes:

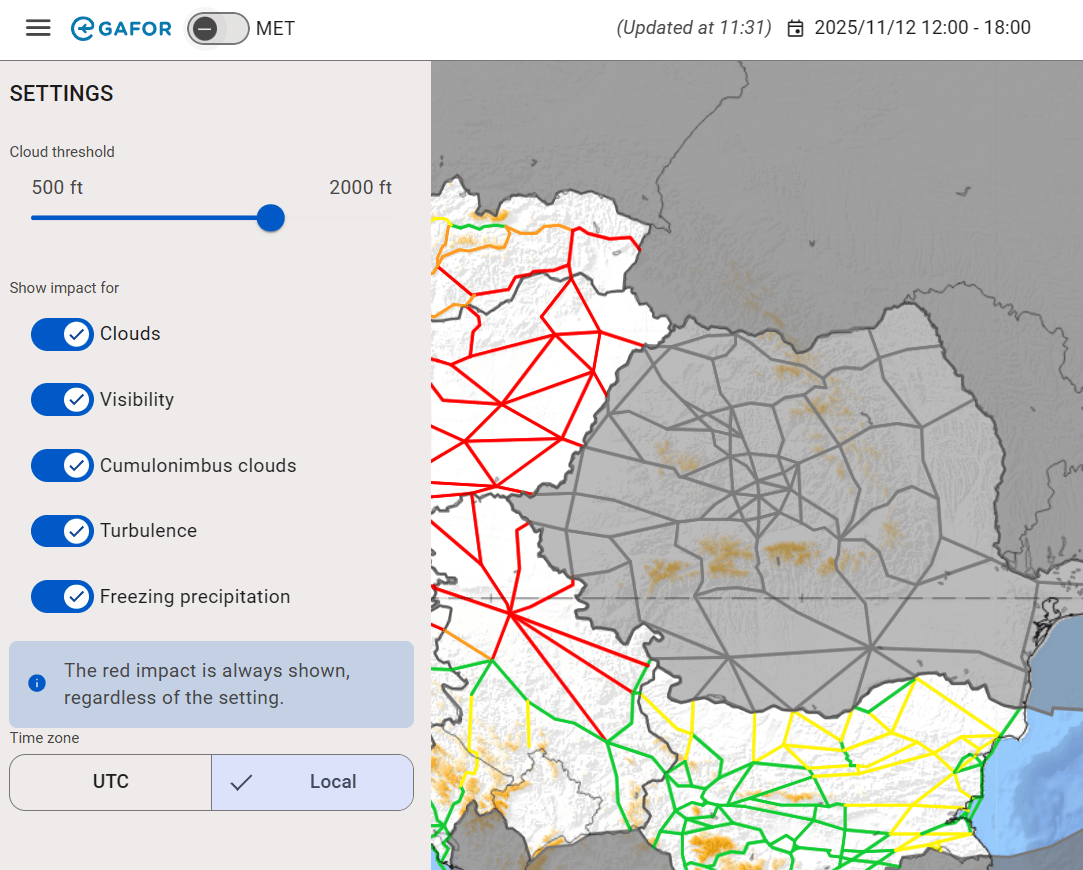
Show impact for
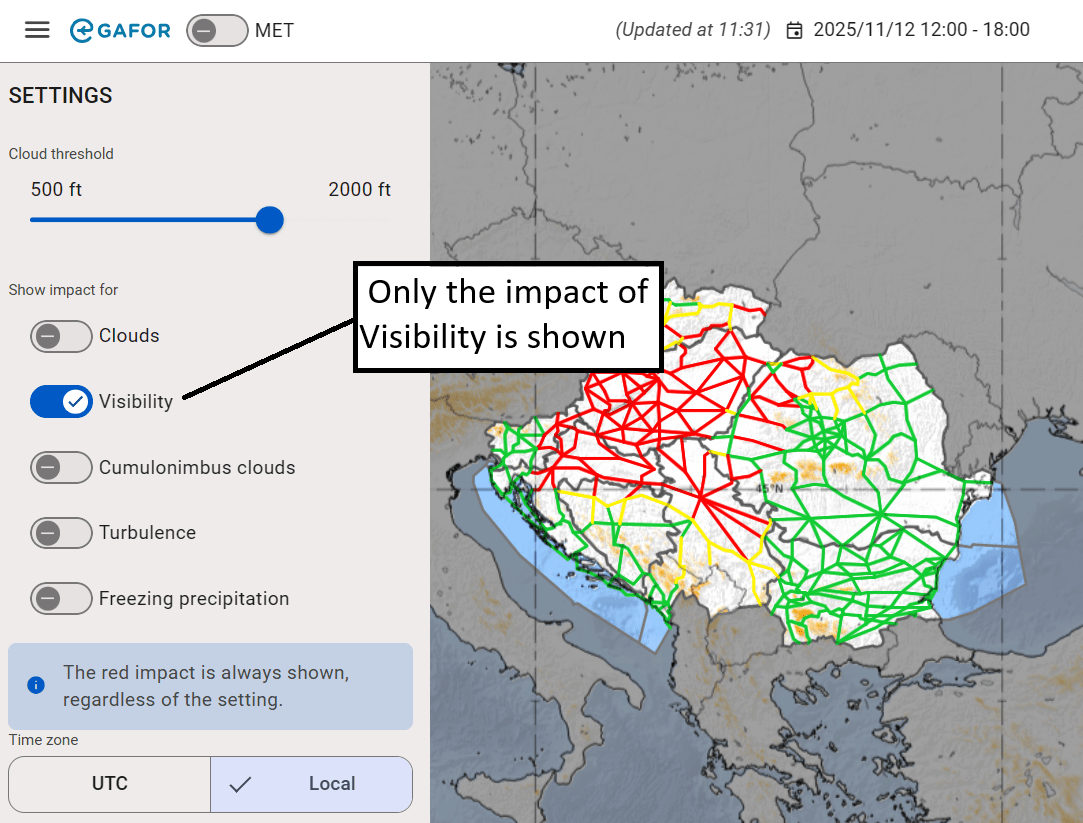
Use the sliders to specify the impact of which phenomena should be displayed: if the slider is on (i.e. is displayed as active), the impact of the phenomenon is displayed on the map.
In the screenshot below, only the impact of the cumulonimbus clouds is selected for display.
 |
Warning |
| If the impact on the route is red, it is always displayed even if the display of all impact types is switched off.
|
|
Hint |
View polygons/impact from multiple forecast intervals at onceIt is possible to view the polygons or the impact from multiple forecast periods at once: hold down the SHIFT key and select the forecast periods from which the information should be displayed. Polygon view from two forecast periods Impact view from two forecast periods |
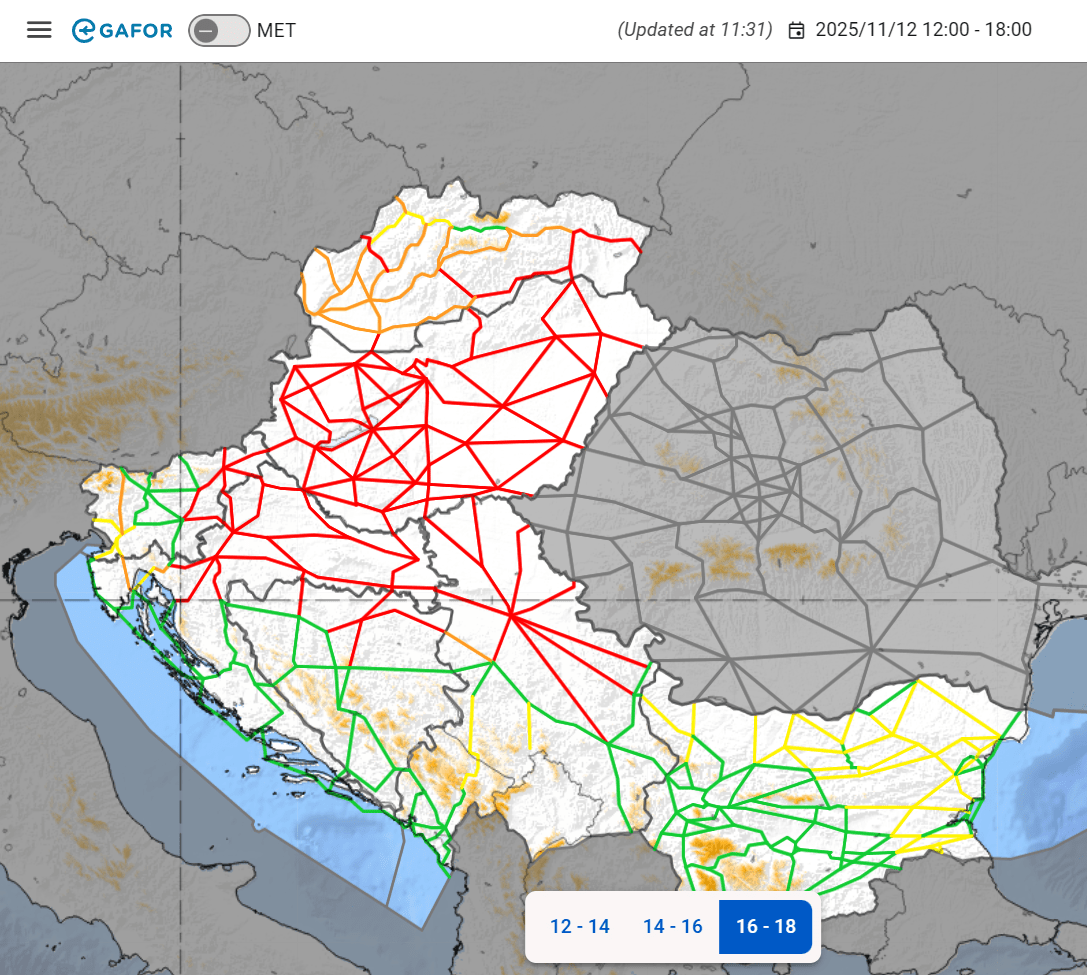
Unissued forecasts
It can happen that one of the meteorological services responsible for issuing the forecast for a certain FIR do not complete the forecast on time or they do not issue the forecast on purpose because for a particular time of the day the issuing of the forecast is not relevant (for example at night in winter months). In this case the FIR for which the forecast was not issued is greyed-out, similar to the FIRs for which the eGAFOR is not issued at all.
If you click a route (in the route impact view) in the FIR for which no forecast was issued, the tooltip will indicated that "There is no issued forecast for selected segment".

Example of route impact view when forecast was not issued for the Buchurest FIR
Example of polygon view when forecast was not issued for the Buchurest FIR
Specify time zone in which time should be indicated
It is possible to select whether the forecast validity (top right corner) and the times in the forecast interval buttons (bottom centre) should be indicated in UTC time or local time. Click ![]() in the top left corner to display the settings and in the Time zone section select UTC or Local.
in the top left corner to display the settings and in the Time zone section select UTC or Local.
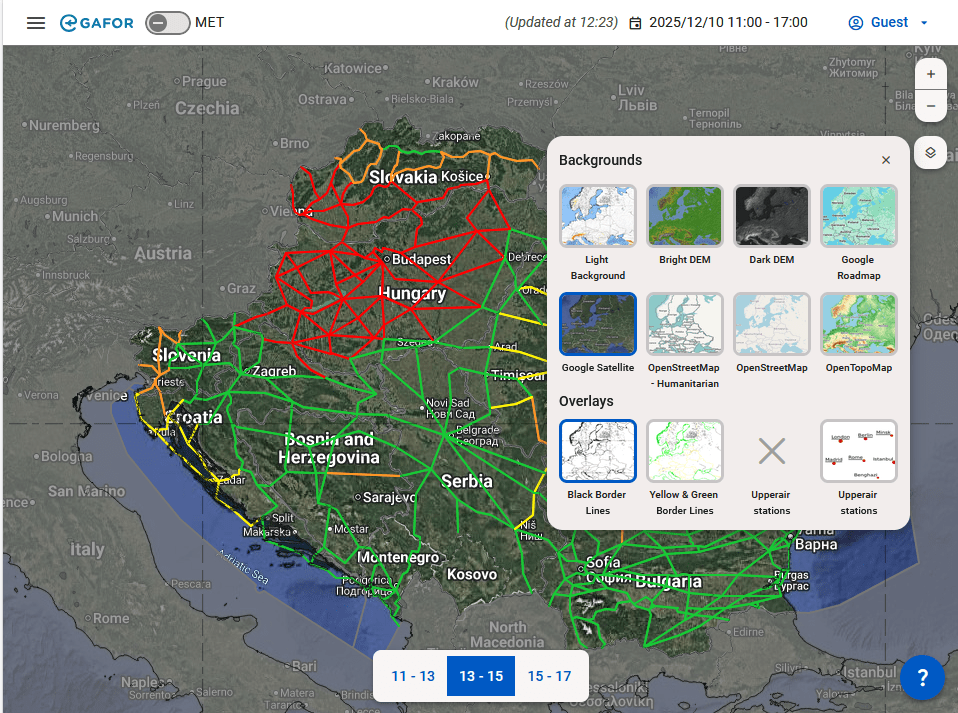
Navigate or change map background
The icons on the right side bar are used for modifying the displayed map background or map area and to access the chat dialog. It is possible to use the icons in the right top corner to zoom in and out and to change the map background.
|
Right side bar |
Action |
Procedure |
|---|---|---|
|
|
Zoom in | Click to zoom in on the map. You can also zoom in by scrolling the mouse wheel forward or by using the CTRL and + keyboard shortcut. |
|
|
Zoom out | Click to zoom out on the map. You can also zoom out by scrolling the mouse wheel backward or by using the CTRL and + keyboard shortcut. |
| Zoom to specific area | Hold down the SHIFT key and use the mouse to mark a rectangle with the required area. | |
| Pan to different area | If you want to pan the map, i.e. move to another part, click and drag until you see the required area. | |
|
|
Backgrounds |
Click to display the thumbnails representing various map backgrounds and then click to select to the required background. |